|
Echoflow
1.0.0
A ROS2 Toolset for tracking marine radar targets
|
|
Echoflow
1.0.0
A ROS2 Toolset for tracking marine radar targets
|
echoflow is a ROS 2 package designed to transform marine radar sector data into a real-time 2D grid map for navigation and environmental awareness. It also runs a multi-target particle filter to track dynamic obstacles using that map.
The package consists of two primary nodes:
radar_grid_map: Generates the grid map from incoming radar data.particle_filter: Tracks dynamic targets using a particle filter over that map.The radar_grid_map node listens to radar sector messages, applies optional near-field clutter filtering, transforms the data into a global map frame using TF2, and publishes both a detailed GridMap and a simplified OccupancyGrid for use in path planning, SLAM, or tracking.
The particle_filter node spawns particles with random position and course angle where radar returns are detected. It iteratively updates particle weights until the filter converges on a stable estimate of position and course for each target. Large blobs (e.g., shorelines) are filtered out based on a configurable maximum_target_size. The node continuously spawns new particles so the filter can quickly react to newly detected objects. A set of particle statistics is also published to optimize tracking performance.
Complete API documentation is available at:
👉 https://seawardscience.github.io/echoflow/
To install echoflow:
To build the package and all required dependencies:
You may also wish to build with tests and warnings enabled:
After sourcing your workspace, you can start the flow_tracker node which starts both the particle_filter and the radar_grid_map (with appropriate ros args).
A launchfile has been provided to launch both nodes with the parameter configuration file and launch rviz2 with the echoflow rviz configuration:
You will need to set the radar_ns arg match the namespace for your radar data topics.
Make sure appropriate TF data (e.g., map -> radar_frame) and radar sector topics are available.
An example dataset is available here for testing and demonstration purposes. You will be prompted for a username and a password
Once downloaded, you can extract the file and replay it using
once playing use the following to run echoflow
or
This node processes incoming marine radar sectors and builds a continuously updating 2D map.
A launchfile has been provided to run the radar_grid_map node standalone with the parameter configuration file and launch rviz2 with the echoflow rviz configuration:
Set the radar_ns argument to match the namespace of your radar data topics.
Make sure appropriate TF data (e.g., map -> base_link) and radar sector topics are available.
| Topic | Message Type | Description |
|---|---|---|
occupancy_grid | nav_msgs::msg::OccupancyGrid | Simplified occupancy representation |
radar_grid_map | grid_map_msgs::msg::GridMap | Full radar grid map |
| Topic | Message Type | Description |
|---|---|---|
data | marine_sensor_msgs::msg::RadarSector | Incoming radar sector scans |
The above correspond to the standards set in the UNH marine radar messages. Therefore you should run this node in the namespace of the desired radar channels. For example:
This node relies on TF2 to transform incoming radar data from its native frame into the global map frame.
To function correctly, the following TFs must be available and actively published:
halo, base_link, or sensor_frame) to the configured map.frame_id (default: "map").If your radar messages are in the halo frame, and you want to map in the map frame:
Or, more likely, dynamically broadcast it from your navigation or localization system.
map.frame_id — this is the target frame for the radar grid map.header.frame_id set to the source frame.⚠️ If TF lookups fail, the node will not process radar messages until a valid transform becomes available.
| Parameter Name | Type | Default Value | Description |
|---|---|---|---|
map.frame_id | std::string | "map" | The fixed frame for the output grid map. |
map.length | float | 10000.0 | Length of the map area in meters. |
map.width | float | 10000.0 | Width of the map area in meters. |
map.resolution | float | 10.0 | Resolution (cell size) of the map in meters. |
map.pub_interval | float | 0.1 | Time between costmap publication updates (seconds). |
filter.near_clutter_range | float | 30.0 | Maximum range in meters for clutter filtering. |
max_queue_size | int | 1000 | Maximum radar message queue length. |
Example configuration snippet:
This node uses the 2D map from the radar_grid_map node to run a particle filter for tracking multiple dynamic targets.
| Topic | Message Type | Description |
|---|---|---|
particle_cloud | sensor_msgs::msg::PointCloud2 | Particle point cloud |
particle_filter_statistics | grid_map_msgs::msg::GridMap | Particle filter statistics |
cell_vector_field | geometry_msgs::msg::PoseArray | Displays vector showing mean course angle per cell |
particle_vector_field | geometry_msgs::msg::PoseArray | Displays vector showing course angle per particle |
None. The particle_filter node accesses the radar grid map using a shared pointer to the map between nodes for efficiency.
| Parameter Name | Type | Default Value | Description |
|---|---|---|---|
particle_filter.density_feedback_factor | float | 0.8 | Density (particles/m^2) at which the weight of a particle will be reduced by half. Lower this value if you have issues with particles too aggressively clustering on single targets. |
particle_filter.initial_max_speed | float | 20.0 | Maximum speed (m/s) assigned to particles during initialization. |
particle_filter.maximum_target_size | float | 200.0 | Maximum physical size (in meters) for a trackable target blob. Used to reduce computational load on large targets like shorelines. |
particle_filter.noise_std_position | float | 0.1 | Standard deviation (m) of positional noise added during resampling. |
particle_filter.noise_std_speed | float | 0.2 | Standard deviation (m/s) of speed noise added during resampling. |
particle_filter.noise_std_yaw | float | 0.05 | Standard deviation (radians) of yaw angle noise added during resampling. |
particle_filter.noise_std_yaw_rate | float | 0.0 | Standard deviation (radians/sec) of yaw rate noise added during resampling. |
particle_filter.num_particles | int | 100000 | Total number of particles used in the filter. |
particle_filter.observation_sigma | float | 50.0 | Standard deviation (m) of the observation likelihood model. |
particle_filter.seed_fraction | float | 0.001 | Fraction of particles (per second) that are reseeded with random poses on each resample step Increase this value to more quickly lock on to newly detected targets. |
particle_filter.update_interval | float | 0.2 | Time (in seconds) between particle weight updates. |
particle_filter.weight_decay_half_life | float | 3.0 | Half-life (in seconds) for exponential decay of particle weights. Lower values cause weights to fade more quickly over time. Generally, this should be on the order of the radar sweep time. |
particle_filter_statistics.frame_id | std::string | "map" | Coordinate frame in which the particle statistics map is published. |
particle_filter_statistics.pub_interval | float | 0.5 | Time interval (in seconds) between publishing the statistics map. |
particle_filter_statistics.resolution | float | 25.0 | Resolution of each grid cell (in meters). |
Example configuration snippet:
The particle_filter node publishes a set of metrics calculated from the particles. These metrics are published as a separate grid map containing multiple layers, each layer corresponding to a particular metric. These metrics can be visualized in Rviz.
Metrics are calculated for any cell of the grid containing at least one particle. All metrics are NaN for cells where no particles exist.
| Metric | Layer Name | Data Type | Description |
|---|---|---|---|
| Particles per cell | particles_per_cell | int | Number of particles in cell. |
| Particle age | particle_age_mean | float | Mean age of particles in cell (how long ago they were first spawned) (arithmetic mean). |
particle_age_ssdm | float | Sum of squared deviations from mean (used for calculating standard deviation). | |
particle_age_std_dev | float | Standard deviation of age of particles in cell. | |
| X position | x_position_mean | float | Mean x-position of particle location within cell (arithmetic mean). |
x_position_ssdm | float | Sum of squared deviations from mean (used for calculating standard deviation). | |
x_position_std_dev | float | Standard deviation of x-position of particles in cell. | |
| Y position | y_position_mean | float | Mean y-position of particle location within cell (arithmetic mean). |
y_position_ssdm | float | Sum of squared deviations from mean (used for calculating standard deviation). | |
y_position_std_dev | float | Standard deviation of y-position of particles in cell. | |
| Speed | speed_mean | float | Mean of speed of particles in cell (arithmetic mean). |
speed_ssdm | float | Sum of squared deviations from mean (used for calculating standard deviation). | |
speed_std_dev | float | Standard deviation of speed of particles in cell. | |
| Course | course_mean | float | Mean course angle of particles in cell (circular mean). |
course_std_dev | float | Standard deviation of course angle of particles in cell (circular standard deviation). | |
course_sines | float | Sum of sines of course angles (used for calculating circular statistics). | |
course_cosines | float | Sum of cosines of course angles (used for calculating circular statistics). The sines and cosines of the angles represent their conversion from polar to Cartesian coordinates for calculating the circular mean, variance, and standard deviation. |
Currently, this node does not provide ROS2 services.
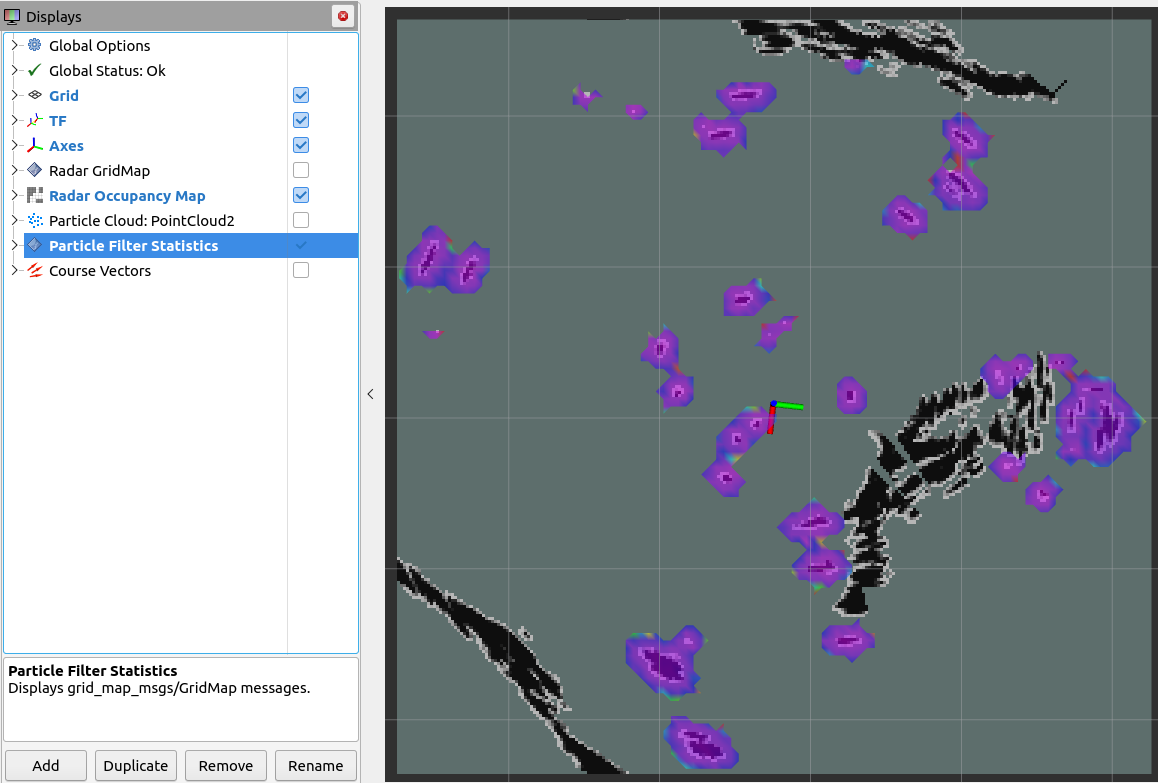
The visualization for this package is done in rviz2. A config file is provided which sets up all the display plugins needed to visualize the data.
The radar_grid_map includes the following layers:
maximum_target_size parameter. 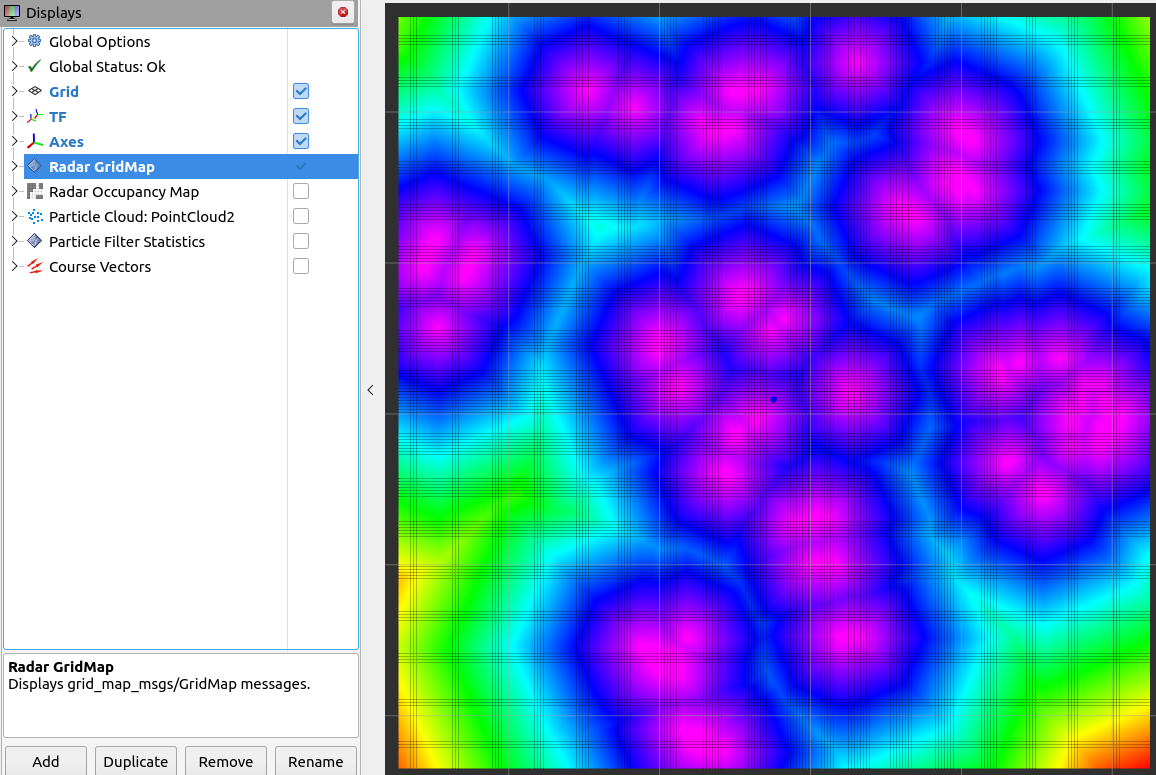
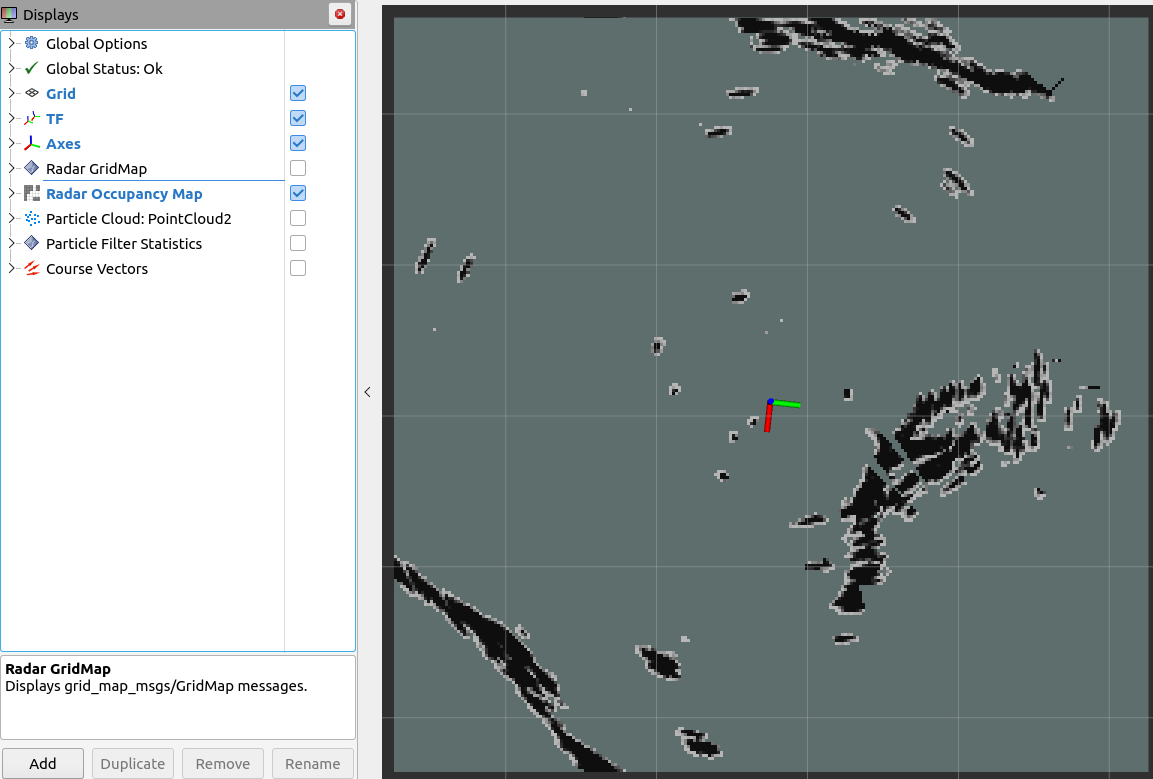
This display shows an occupancy map of the current grid map, showing where on the map radar returns exist.
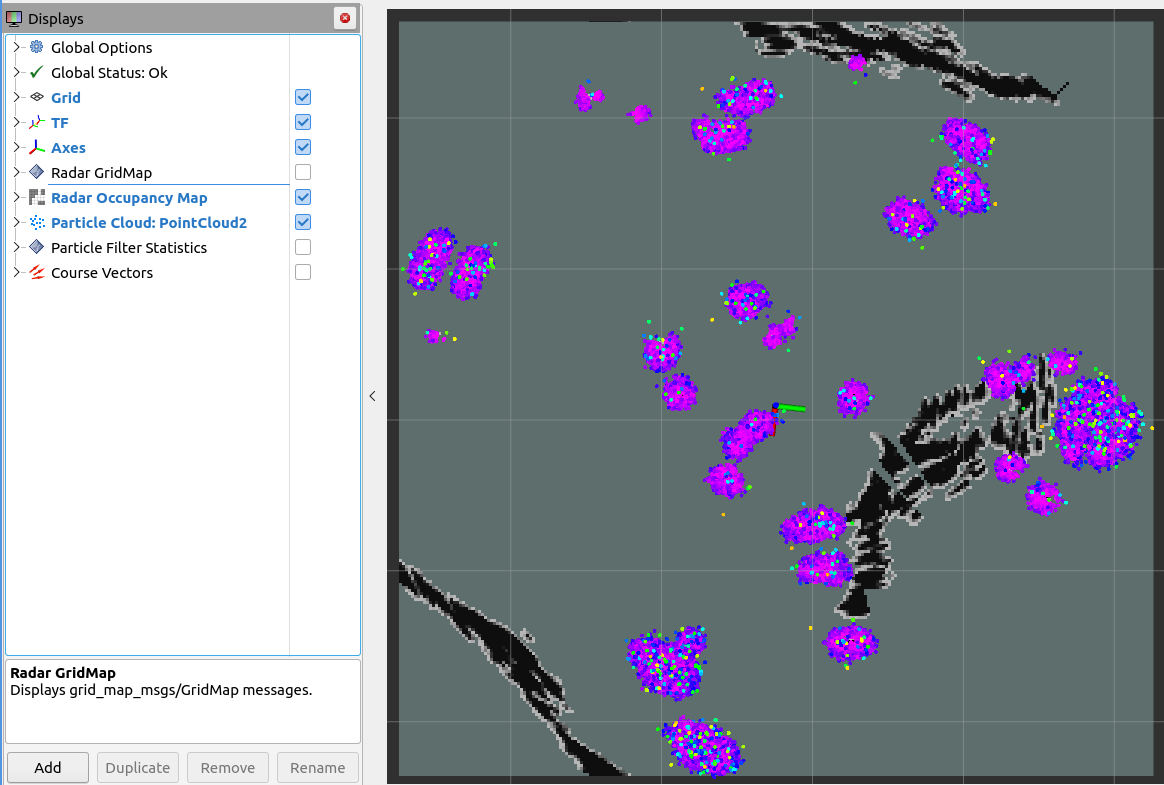
This display shows a PointCloud2 visualization of the particles spawned on the map.
You can select different channels as the color transform to visualize various particle metrics:
This displays a heatmap of the selected particle filter statistics layer. Change the Color Layer selection to visualize different metrics for the particle filter. The default metric visualized is the mean speed per cell.
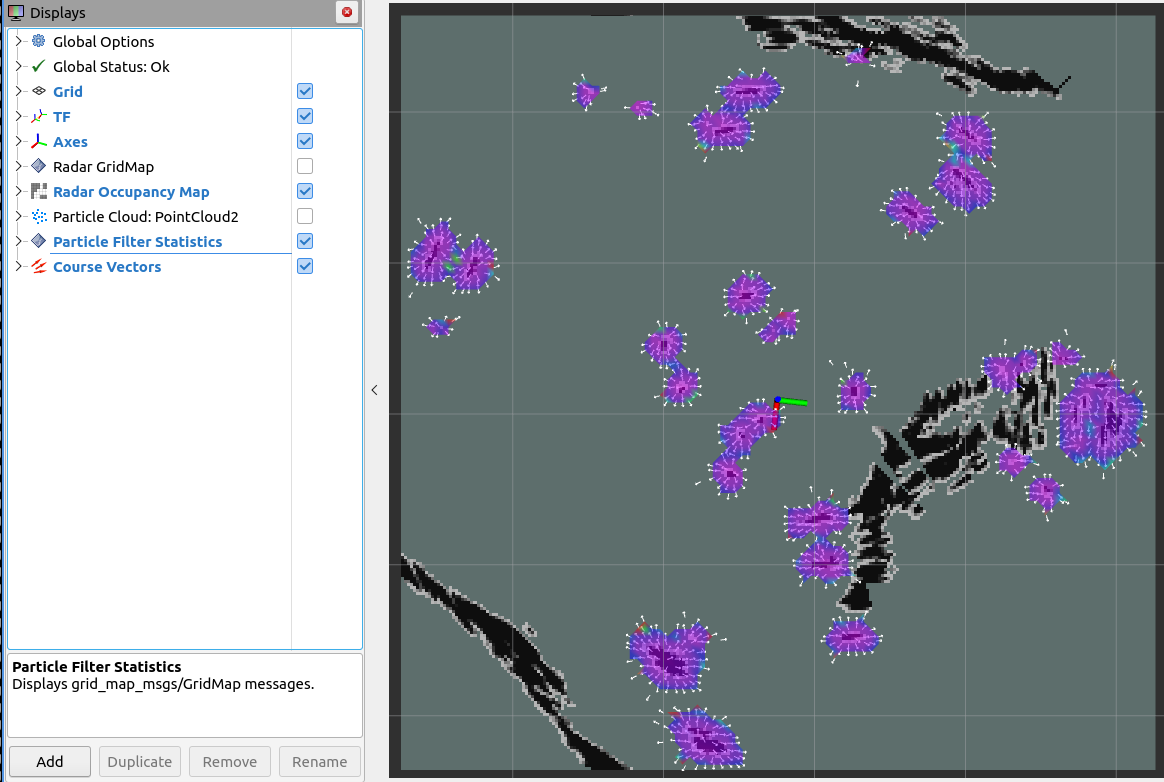
This displays a vector field of the course angles. The default topic to display is the mean course angle per cell in the particle statistics map, called cell_vector_field. You can also display the course angle for each individual particle by selecting the particle_vector_field topic.
We welcome contributions! Please read the CONTRIBUTING.md guidelines to get started.
When making contributions, remember:
master branch.ament_cpplint to ensure your code matches the style guidlines.Documentation is auto-generated using Doxygen. Doxygen can be installed from apt with:
sudo apt install doxygen
You will also need to install LaTeX, Ghostscript, and dvips in order to compile the math formulas in the documentation (more details in the Doxygen manual). All necessary packages can be installed by the following:
sudo apt install texlive texlive-latex-extras
This project is licensed under the [LICENSE](LICENSE) provided in this repository.
Developed by Seaward Science for University of New Hampshire Center for Coastal and Ocean Mapping CCOM